dnEnviro has various methods of using the data
collected from our (and 3rd party) sensors. We split the use into three
distinct areas as each has its own tools and techniques that facilitate better
and more detailed data analysis.
- ALERT REPORTING
- TREND ANALYSIS
- ANALYTICS
With ALERT REPORTING, the data is monitored in real-time,
looking for data variations. These variations are specified by the customer and
are very customisable. They are generally where a sensor is reporting results
out of the expected norm. For example, where the temperature is too high or
low, where water is detected, or the room occupancy is too high. In these
scenarios, our solution will report alerts back to specified users.
Usually sent via email or SMS, these alerts can be set to multiple users (or
systems) to escalate or, if the same alert is reported for 5 minutes, more
people are notified. The solution also accommodates compound alerting so that
the results from multiple sensors are combined before alerts are triggered. For
example, someone is in a room and the temperature is too high.
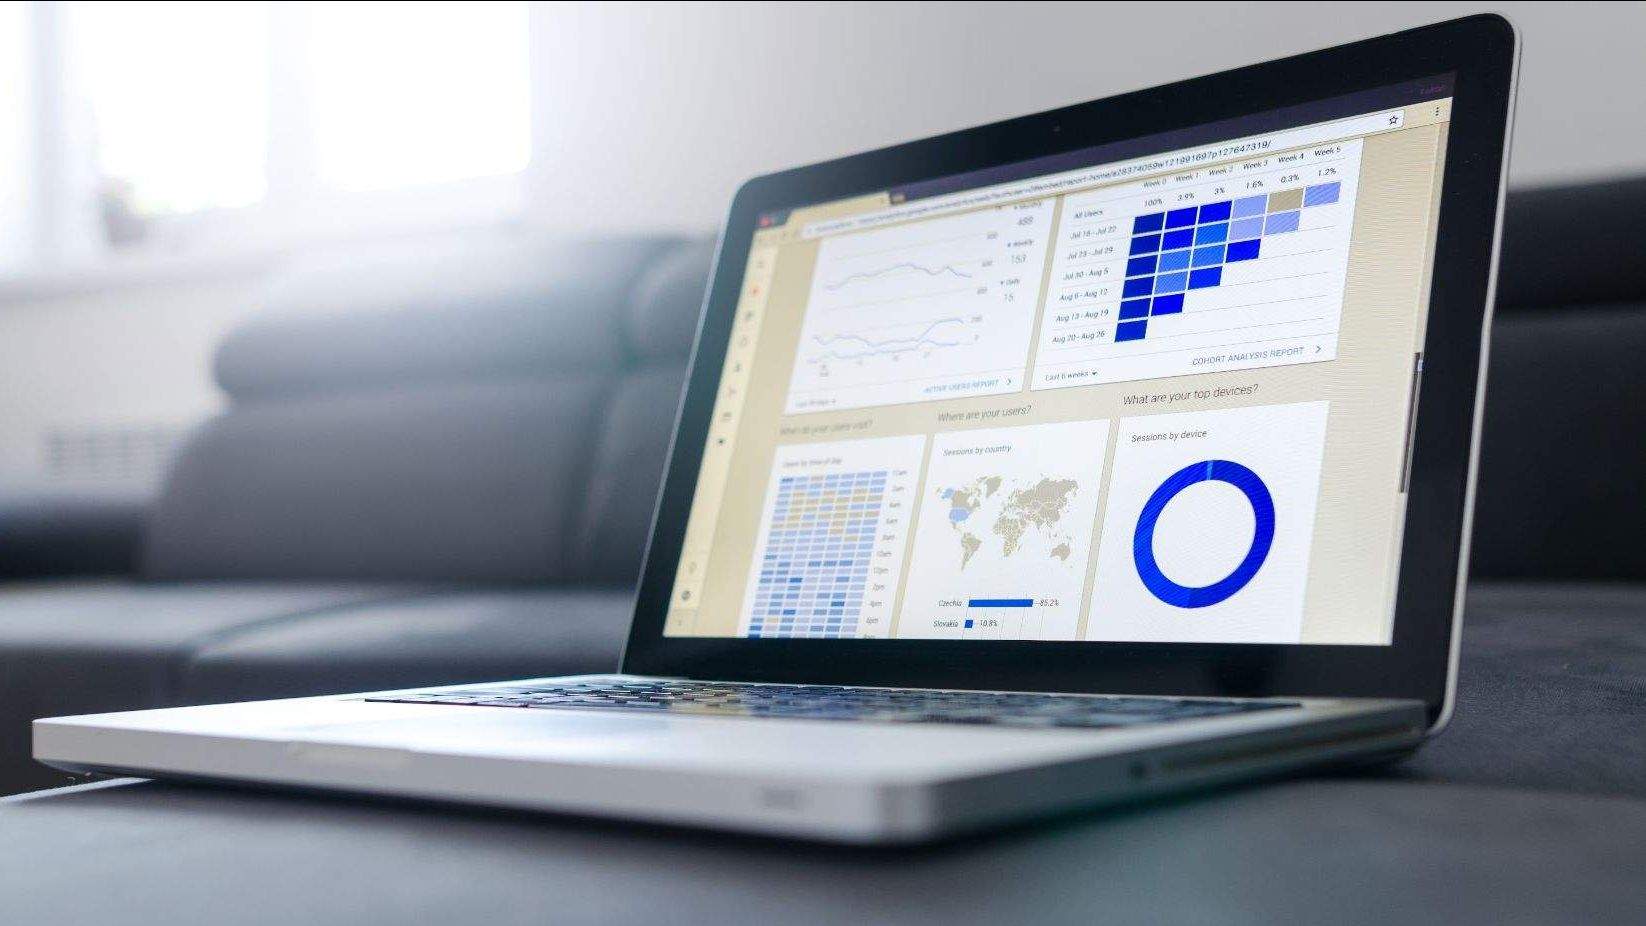
TREND ANALYSIS within our platform allows
authorised users to look at the performance of sensors. These reports can be
viewed within the platform and exported for further analysis or sharing with
colleagues. They show the performance of one or more sensors (overlay on top of
each other if required) over time. This is useful to check on expected
performance, looking for spikes or ascertaining what the sensors were reporting
at a particular time.
ANALYTICS ... The real power of sensor data is the ability to look for data anomalies
or data trends that are not visible to the human eye. The human ability to look
over large amounts of data and see patterns is extremely limited, but for the
computer, this is an area it excels in. We fundamentally believe the true power of deploying
sensors and collecting the data is to understand that small changes can have a
significant impact.